Bank holiday changes to council services
Introduction
These figures were published by the Department for Work and Pensions in March 2026 and cover the period up to March 2025. It looks at:
- How many children aged 0 to 15 years, or aged 16 to 19 in full-time non-advanced education or in unwaged government training, are living in poverty in Brighton & Hove
- How this differs before and after housing costs
- How this compares to other UK regions
- Trends
How we measure child poverty
How we measure child poverty
Child poverty measures the number and percentage of children living in households with income below 60% of the national median.
The Department for Work and Pensions publishes annual figures for each local authority.
Two measures are used:
- Before housing costs (BHC) – household income is measured before rent, mortgage payments and other housing costs are taken into account
- After housing costs (AHC) – household income is measured after housing costs have been paid
Children who meet these criteria are considered to be living in relative poverty.
In Brighton & Hove, the after housing costs measure is particularly important because high housing costs can have a significant impact on family finances. Both measures are presented in this briefing.
Children in these statistics
Children aged 0 to 15 years, or aged 16 to 19 in full-time non-advanced education or in unwaged government training.
Low-income families in these statistics
To be included in these statistics, a family must have claimed Child Benefit and at least one other qualifying benefit during the year, such as Universal Credit, Tax Credits or Housing Benefit.
This approach is used by the Department for Work and Pensions to identify children living in relative low-income families.
Children in low income families: local area statistics
Annual Official Statistics on the number and proportion of children living in low income families.
Poverty Statistics - End Child Poverty
Child poverty in Brighton & Hove in 2024/25
Housing costs push child poverty from 14% to 22%
Before housing costs (BHC)
This is when income is measured before housing costs are taken into account .
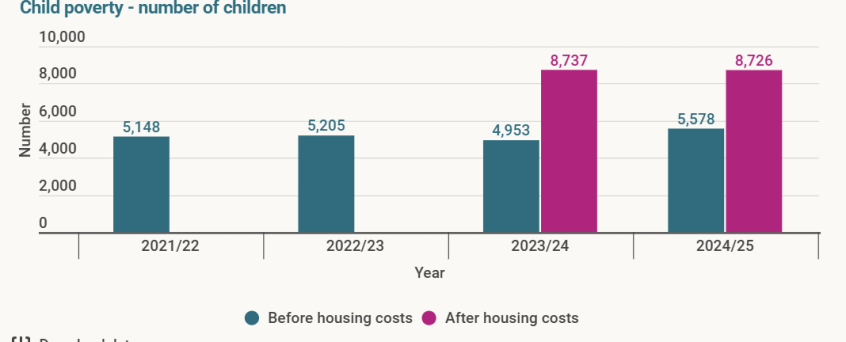
In 2024/25, 5,578 children aged 0-15 years in Brighton & Hove were living in relative poverty - around 1 in 7 (14%) - before housing costs.
After housing costs (AHC)
This is when income is measured after housing costs have been paid
After housing costs, child poverty increases to 8,726 - over 1 in 5 children in the city (22%).
That's over 3,000 more children experiencing poverty because of the high cost of housing in our city.
Child poverty trends in Brighton & Hove
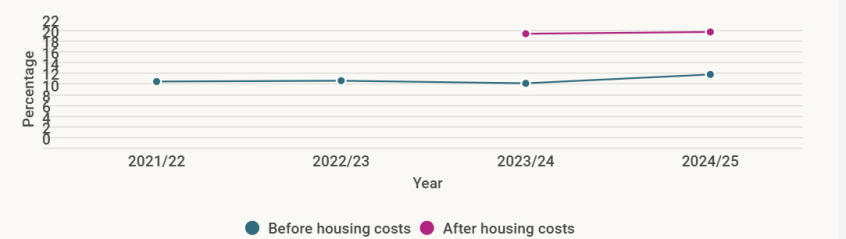
The percentage of children living in poverty before housing costs increased from 12% in 2021/22 to 14% in 2024/25, rising from 5,148 to 5,578 children.
Data on child poverty after housing costs is only available from 2023 to 20224 onwards.
After housing costs, child poverty increased from 21% in 2023 to 2024 to 22% in 2024 to 2025. The number of children affected remained similar, at around 8,700.
Child poverty (% of 0 to 15 year olds living in households with below median 60% earnings - before and after housing costs), Brighton & Hove 2021/22 to 2024/25
Child poverty - number of children
Child poverty data
| % Before housing costs | % After housing costs | Number of children before housing costs | Number of children after housing costs | |
|---|---|---|---|---|
| 2021 to 2022 | 12.40% | 5,148 | ||
| 2022 to 2023 | 12.60% | 5,205 | ||
| 2023 to 2024 | 12.10% | 21.40% | 4,953 | 8,737 |
| 2024 to 2025 | 13.80% | 21.60% | 5,578 | 8,726 |
Comparing national and regional data
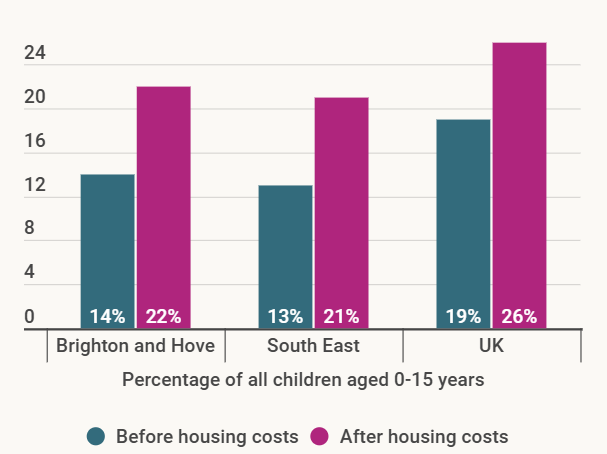
Before housing costs, the child poverty rate in Brighton & Hove was lower than the UK in 2024/25 (14% compared with 19%) and similar to the South East (13%).
After housing costs are taken into account, child poverty rates increase across all areas. In Brighton & Hove, 22% of children were living in poverty after housing costs, compared with 26% across the UK and 21% in the South East.
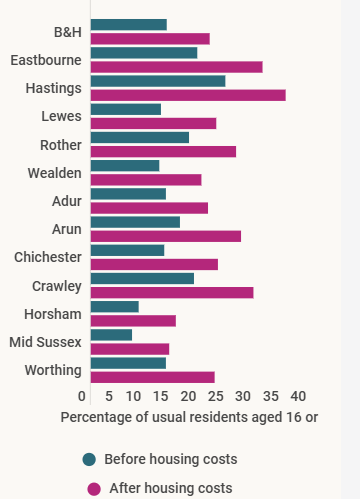
Across Sussex, an estimated 41,394 children were living in poverty before housing costs, rising to 67,409 after housing costs. Brighton & Hove had the highest number of children living in poverty of any lower-tier local authority in Sussex.
Within Sussex, child poverty rates varied considerably. Before housing costs, rates ranged from 8% in Mid Sussex to 24% in Hastings. After housing costs, rates ranged from 14% in Mid Sussex to 35% in Hastings.
Child poverty (% of 0 to 15 year olds living in households with below median 60% earnings - before and after housing costs), Brighton & Hove, South East and UK 2024 to 2025
| Before housing costs | After housing costs | ||
|---|---|---|---|
| Brighton & Hove | 14% | 22% | |
| South East | 13% | 21% | |
| UK | 19% | 26% |
Child poverty (% of 0 to 15 year olds living in households with below median 60% earnings - before and after housing costs) in Sussex lower tier local authorities in 2024 to 2025
| Before housing costs | After housing costs | ||
|---|---|---|---|
| Brighton & Hove | 13.80% | 21.60% | |
| Eastbourne | 19.30% | 31.20% | |
| Hastings | 24.40% | 35.40% | |
| Lewes | 12.70% | 22.80% | |
| Rother | 17.80% | 26.40% | |
| Wealden | 12.40% | 20.00% | |
| Adur | 13.60% | 21.30% | |
| Arun | 16.20% | 27.30% | |
| Chichester | 13.30% | 23.00% | |
| Crawley | 18.80% | 29.50% | |
| Horsham | 8.70% | 15.40% | |
| Mid Sussex | 7.50% | 14.20% | |
| Worthing | 13.60% | 22.50% |
Child poverty varies across local wards
Only child poverty estimates after housing costs are presented here.
In 2024/25, Whitehawk and Marina had the highest number of children living in poverty, with 846 children affected.
More than one in three children were living in poverty after housing costs in four wards:
- Whitehawk and Marina (38%)
- Moulsecoomb & Bevendean (37%)
- West Hill & North Laine (36%)
- Coldean & Stanmer (33%)
These findings show that child poverty is concentrated in some parts of the city, this is mapped on the next page.
| Ward | % |
|---|---|
| Whitehawk and Marina | 37.50% |
| Moulsecoomb & Bevendean | 37.00% |
| West Hill & North Laine | 35.50% |
| Coldean & Stanmer | 33.10% |
| North Portslade | 28.20% |
| South Portslade | 26.90% |
| Woodingdean | 26.30% |
| Kemptown | 24.90% |
| Queen's Park | 24.30% |
| Hangleton & Knoll | 23.00% |
| Regency | 23.00% |
| Hanover & Elm Grove | 21.60% |
| Central Hove | 20.30% |
| Patcham & Hollingbury | 18.50% |
| Brunswick & Adelaide | 18.30% |
| Goldsmid | 17.60% |
| Wish | 16.30% |
| Rottingdean & West Saltdean | 15.90% |
| Hollingdean & Fiveways | 15.80% |
| Preston Park | 15.10% |
| Round Hill | 14.40% |
| Westbourne & Poets' Corner | 13.60% |
| Westdene & Hove Park | 8.00% |